F1 Telemetry Analysis Tool
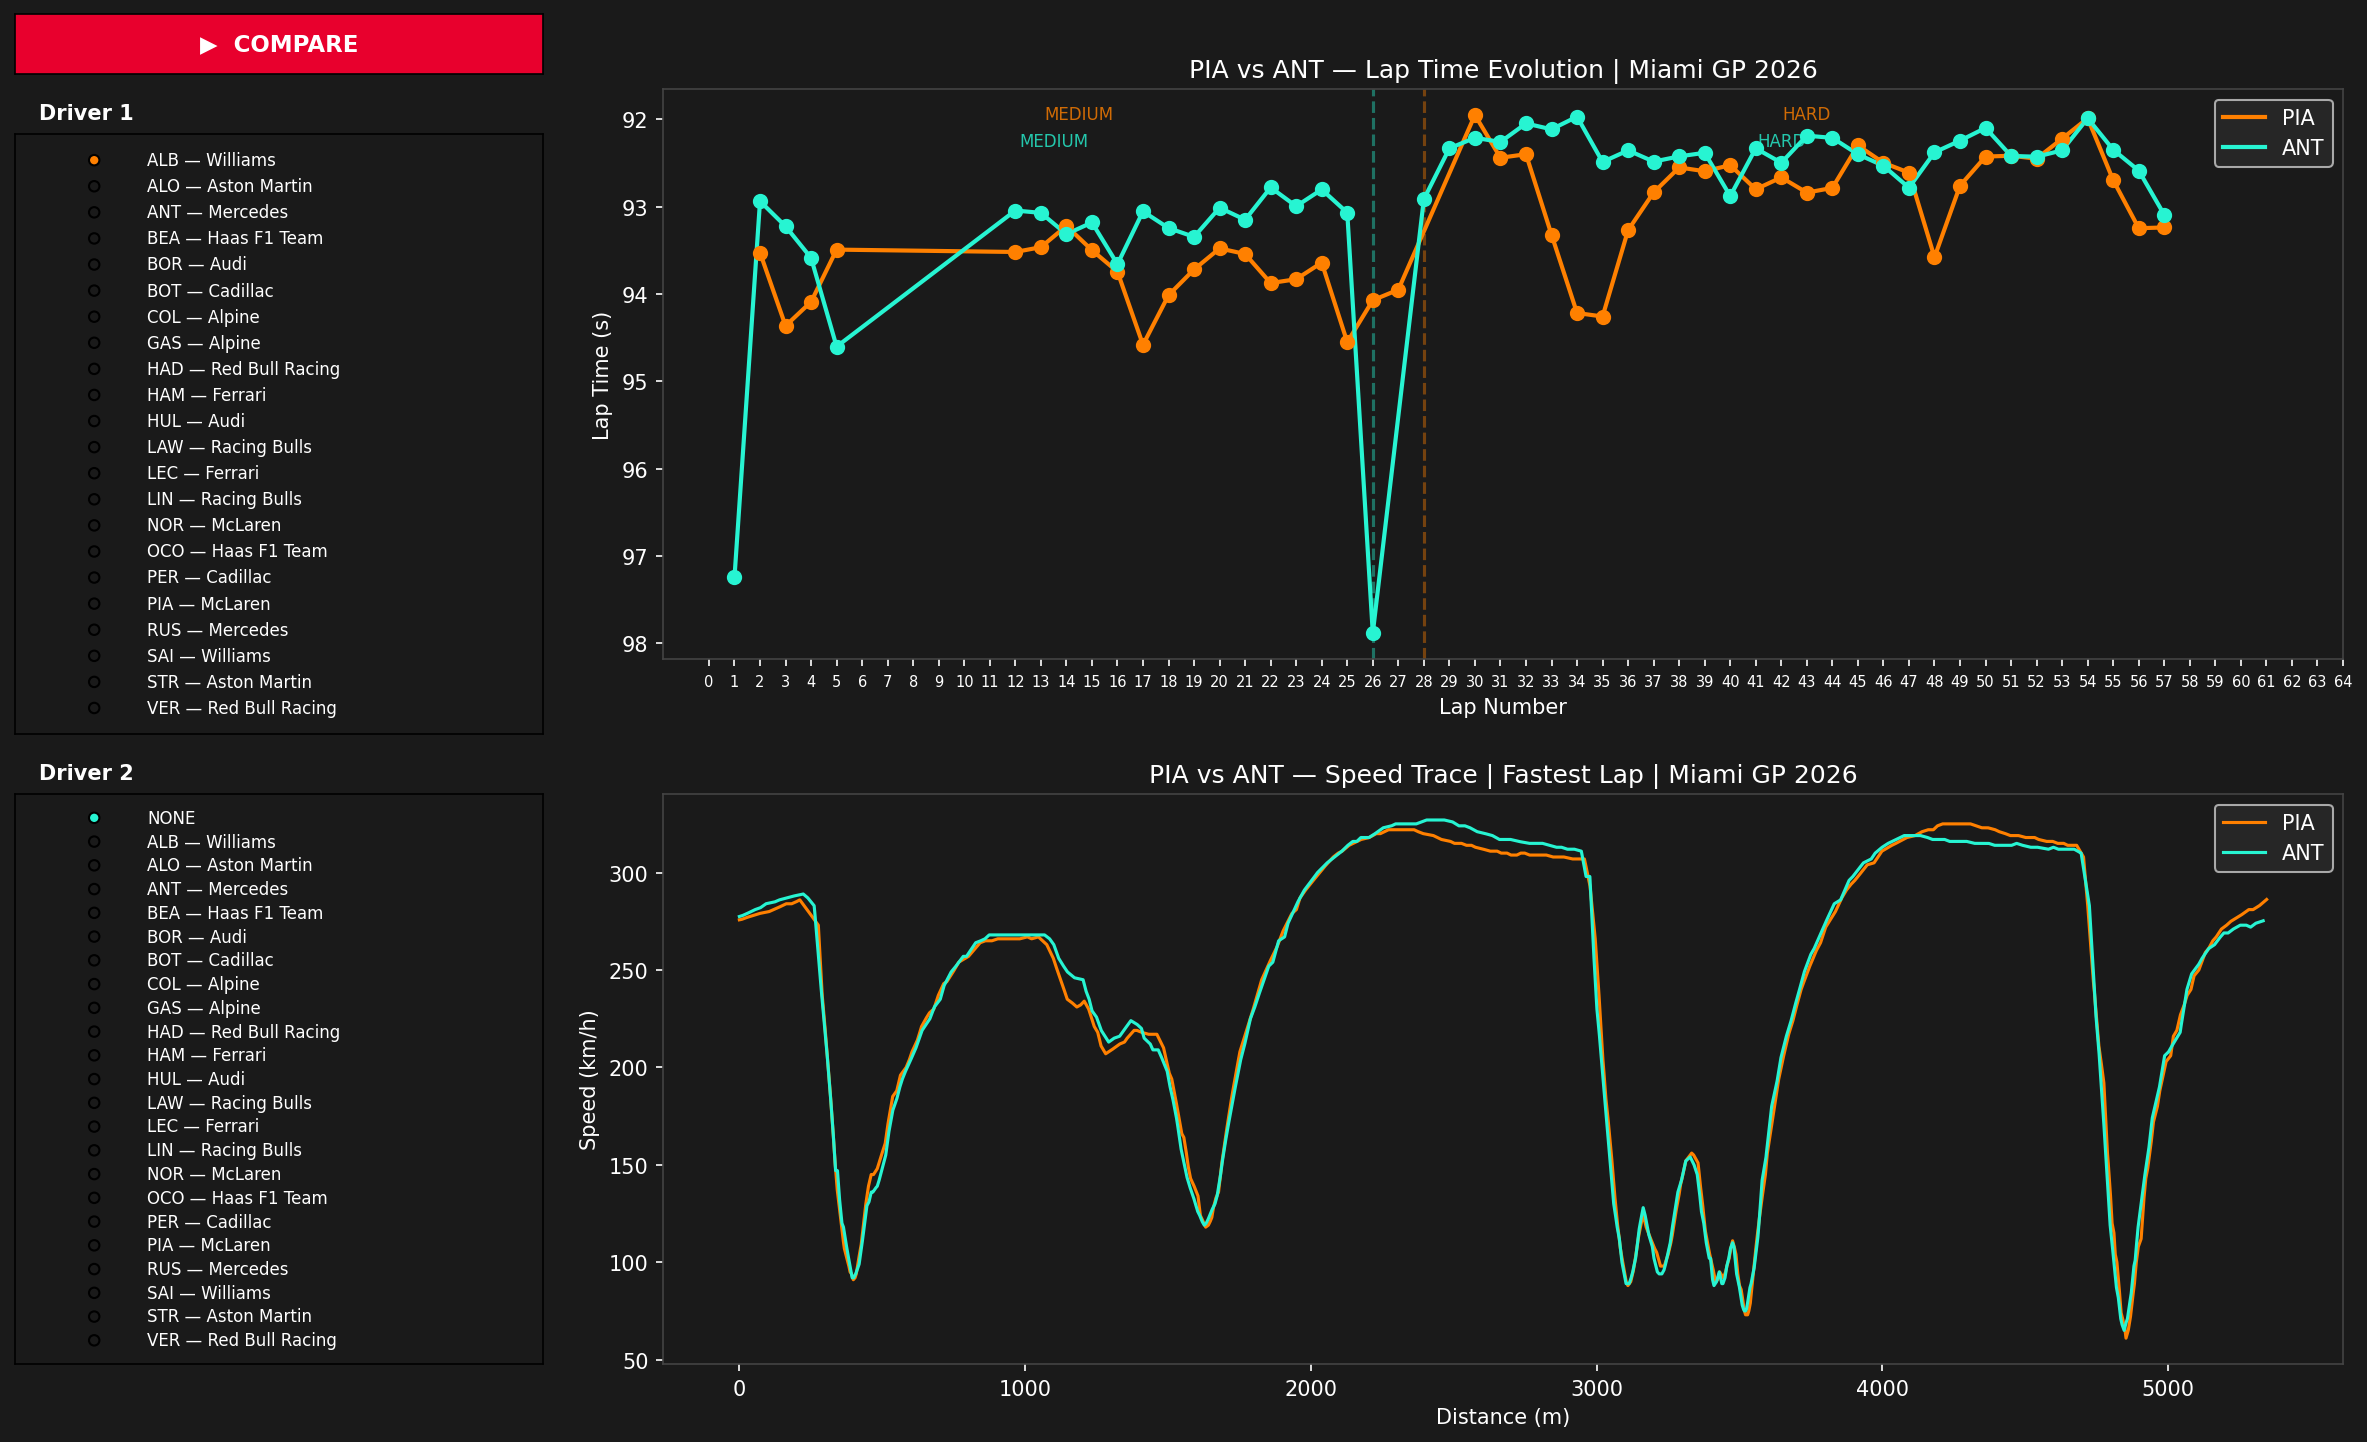
Interactive F1 telemetry analysis tool — compare any two drivers from the full grid with lap time evolution, speed trace and pit stop strategy from real race data.
Context
A self-directed learning project towards F1 software engineering. Using real race data to understand how teams analyze strategy, tyre degradation and driver performance.
What it does
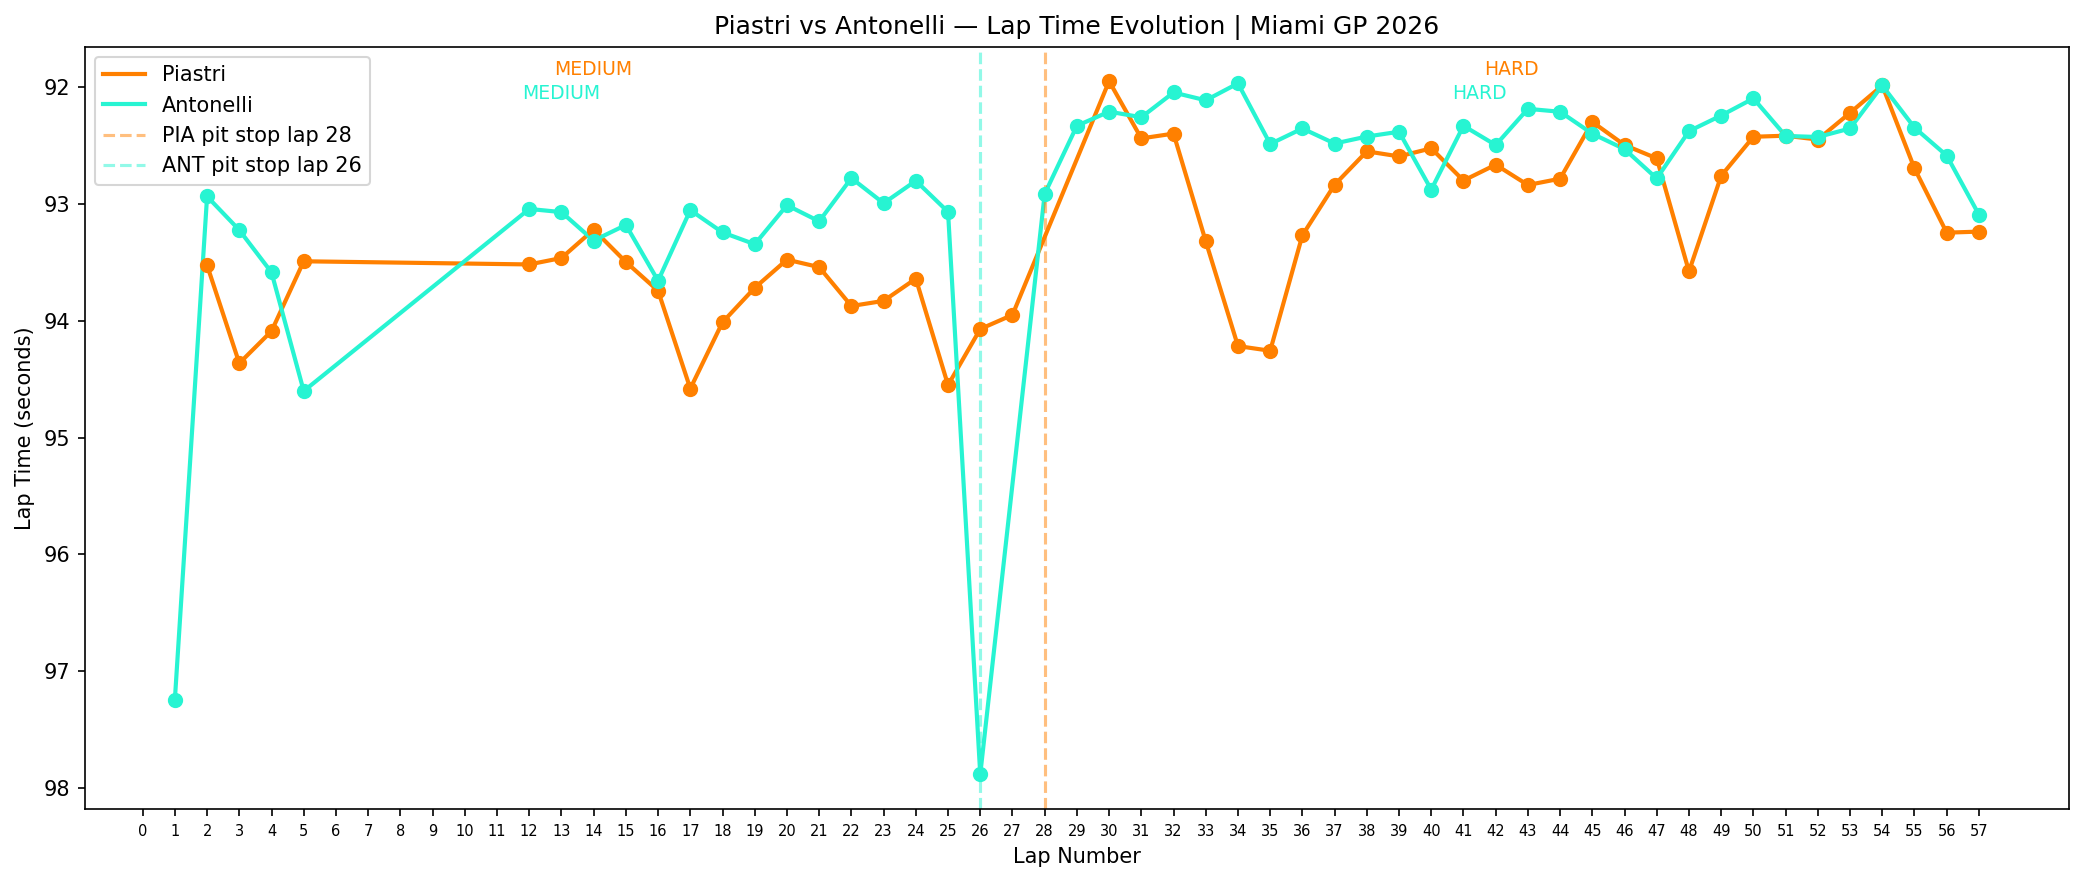
Features an interactive driver selector with the full 2026 grid. Select any two drivers and instantly compare their lap time evolution and speed trace side by side. Includes automatic pit stop detection, tyre compound labels per stint, team colors and hover tooltips showing exact lap times. Analysis of the 2026 Miami GP.
Real-world reference
Data sourced directly from the official F1 timing API via FastF1 — the same data feed used by teams during race weekends.
What I learned
How to work with real telemetry data, detect pit stops programmatically from lap time deltas, and build clear visualizations that tell a story from raw numbers.